


See your live data in 15 minutes | Available on Webex App Hub
One Dashboard.
The platform equips managers with powerful real-time analytics that monitor KPIs.
Run real-time performance reports.
The Problem You Know Too Well
You're running a contact center with scattered data across multiple systems. Your supervisors spend hours exporting spreadsheets instead of coaching agents. By the time you see yesterday's numbers, the problems have already cost you customers.
Sound familiar?

Your Data Unified & Accessible in Real-time.
The NexGen + Webex Contact Center integration automatically syncs every KPI from your Webex dialer directly into NexGen dashboards. Every call. Every agent. Every metric. Mapped correctly. Updated in real-time.
-
See what's happening right now, not what happened yesterday.
Call volume, duration, handle time, hold time
Abandonment, transfer, and wrap-up rates
Talk time, idle time, queue summaries
-
Every interaction mapped to the right agent automatically.
No more manual reconciliation
Single source of truth for performance history
Consistent tracking across queues and campaigns
-
Everything your team needs in one dashboard.
Live scorecards with trend lines
Threshold alerts for coaching moments
One-click exports for reviews
Configurable views by agent, queue, or campaign
Ticker messages to send instant shout-outs or corrections as it happens.
Without This Integration
Before & After
❌ Hours wasted on manual reports
❌ Conflicting numbers between systems
❌ Coaching delayed by data gaps
❌ Agent performance unclear
❌ Problems discovered too late
With This Integration
✓ Automatic real-time sync
✓ One source of truth
✓ Instant coaching triggers
✓ 100% attribution accuracy
✓ Issues caught immediately
Pricing
Yearly
$240/User
1-100 Employees*
Self Implementation
$240 Paid Annually (per user)
*For over 100 employees, contact us for custom pricing...
How it works
-
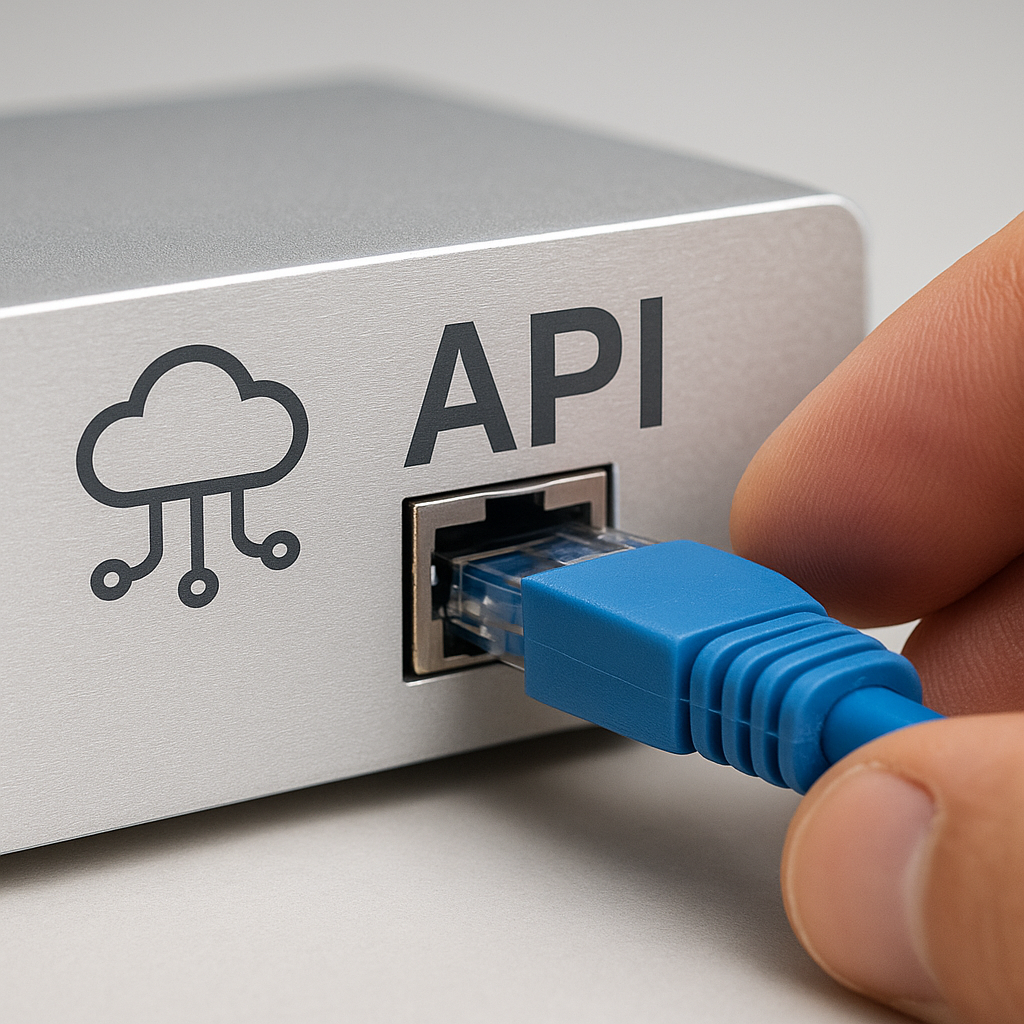
Step 1
We connect to your Webex Contact Center API
-

Step 2
Data flows continuously into NexGen
-
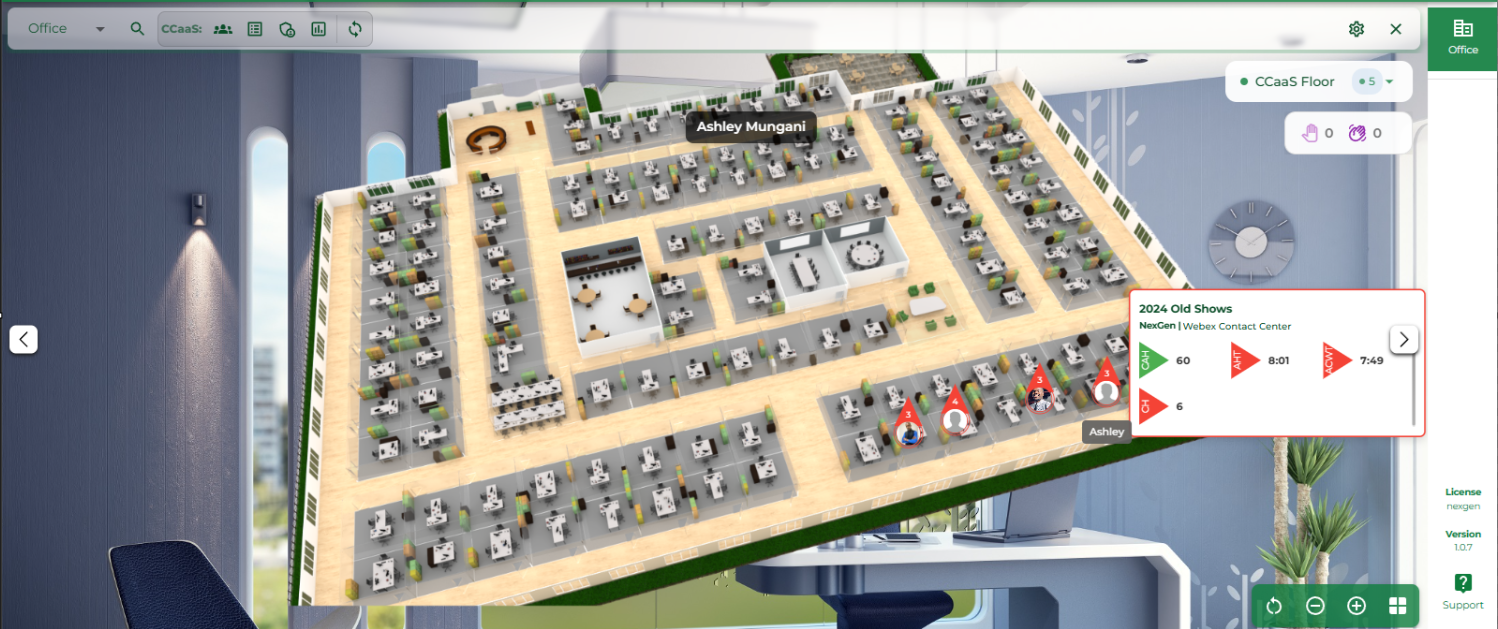
Step 3
Every metric maps to the right agent
-

Step 4
Your dashboards update automatically
-
Under 1 hour
-
Minimal (if your team uses NexGen, they already know it)
-
None (it just works)
What This Means for Your Business
For Supervisors:
Stop building reports. Start coaching agents. See performance issues as they happen, not after the damage is done.
For Leadership:
Consistent KPIs across all teams. Faster decisions. Better forecasting. QBR-ready reports in seconds.
For Agents:
Clear, fair scorecards. No surprises. Objective feedback based on complete data.
For Your Customers:
Shorter wait times. Fewer transfers. Higher first-contact resolution. Better experiences.
Enterprise-Grade. Plug-and-Play. Effortless.
Yes, it really is that simple!
-
SOC 2 and GDPR compliant | Encrypted connections | Role-based access
-
Real-time sync with automatic failover
-
Works for 10 agents or 10,000
-
Full implementation assistance included
“We will pull your actual Webex data and show it mapped in a NexGen dashboard. Your agents. Your queues. Your metrics. Live.”

Courtney Harris
Director of Strategic Partnerships
No generic demo. Your real data.
Three Questions We Always Get
-
Most customers are live within a day. The actual integration takes under an hour.
-
No. It's read-only access to your Webex data. Nothing changes in your existing workflow.
-
Every dashboard is configurable. We'll set it up exactly how you need it.

Stop Chasing Data.
Start Using It.
Available Now on Webex App Hub